Draw(GameTime) sends a drawing command to the GPU driver. The GPU executes those commands asynchronously from a queue, Draw doesn’t wait for the drawing to finish.
EndDraw() wait for the GPU command queue to finish and then swaps the backbuffers to present the new frame.
GT540M takes a bit longer to draw your scene, that’s why you see some execution time shift into EndDraw(). The CPU doesn’t do anything during that time, it waits for the GPU.
Nope, that’s not correct because it has to wait for vblank anyway, it doesnt affect much though if the (potential) framerate is a small fraction of refresh.
I have made more tests. with a blank scene I got more than 60fps so VSync isn’t the cause of slowdown.
I also notice that Texture2D.SetData is disproportionately slower on this laptop.
I use it to create 1 by 1 Texture2D to be able to draw rectangle for UI.
Texture2D texture = new Texture2D(graphicsDevice, 1, 1)
texture.SetData(new { color });
Even if the pixels was cached in memory this code was so slow that the application was completely unusable.
More than 1 second to set only one pixel color.
I replace it by this code:
RenderTarget2D pixel = new RenderTarget2D(graphicsDevice, 1, 1);
graphicsDevice.SetRenderTarget(pixel);
graphicsDevice.Clear(color);
graphicsDevice.SetRenderTarget(null);
With this code all seams to works good.
It is possible that something are missing on those laptop and cause this performance issues ?
No, he won’t (at least by much)… at 10fps in the worst case a frame will be ready to display just a cycle after the vblank so it’ll have to wait 1/60s (-1ht) and that won’t happen a lot of times unless there’s a huge std dt deviation, so if he’s getting 10fps with vsync on, by disabling it he may get say 11fps if he disabled buffering.
That profiling result doesn’t seem correct, but if you’re having half the framerate of a desktop GTX1080 in a GT540M, I’d say that’s somewhat expected in terms of raw performance. I mean, I’d expect the former to be at (very) least 2x as fast as the latter, especially because these mobile cards are nothing special really.
In terms of raw performance it’s 250 gflops vs 8000 gflops, the 1080 is around 32x faster in that metric.
Vsync below 30 fps is working very poorly in my experience and the monogame timestep implementation can have horrible results if targets can not be hit.
I’d still recommend trying to see how the laptop version performs without vsync
Yes, very well said. I’d also recommend checking it without vsync just in case, because you’re right in that regard that sometimes vsync can cause unexpected behaviours, for example I’ve seen recently a strange case in which framerate in windowed mode would always stick to a fraction of the refresh. That being said I really doubt it’s the case and if the test is GPU-bound, at least partially, then that could very well explain the difference. Settings like frame buffering size and in nvidia cards the pre-rendered frames can also cause a difference in benchmarks by releasing the CPU spinning while accepting frames by overriding vblank signaling even when it’s not buffered yet. These nvidia cards have some pretty cool tricks that could render benchmarks useless.
VSync is OFF, I have got more than 60fps with an empty scene.
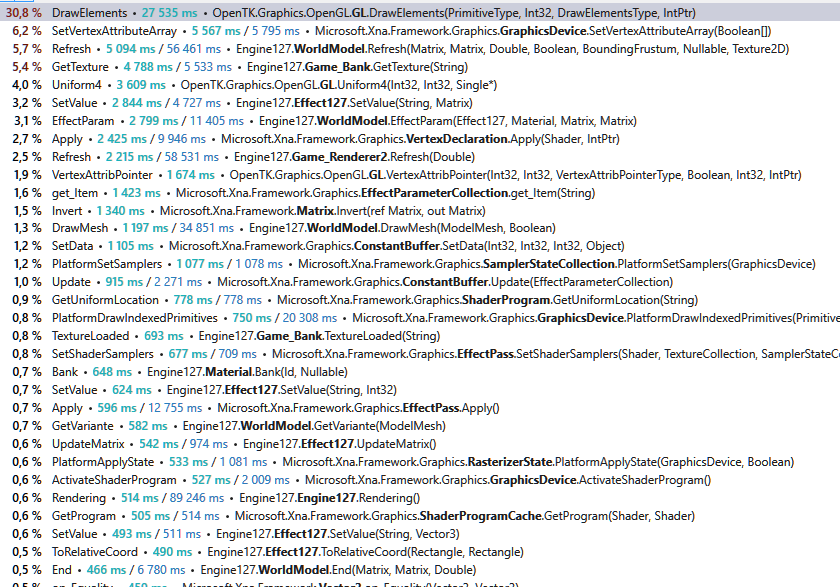
I know my engine isn’t optimized yet, I use multiple material per mesh that means I need to change the effect parameters multiple time for each object. Maybe the 540M is just too slow to handle this amount of Effect.Apply…
I have a nvidia620 and in cases with very numerous objects, and numerous materials, it drops FPS to 10 or below.
On a 870M it runs fine at 120fps. Maybe use a “lower” profile when on the 540: in my engine, when coding with the 620, i use lower specs (LOD, number of details etc aggressively lowered) to not wonder about that.
But it helps to see what happens when a user has a low end computer and test to reproduce their problems, or better, improve algorithms and optimize code.
A computer have in average 12 models, each models have 3 to 10 materials (5 in average).
Only motherboard and certain graphic card have more than 6 materials
The most common: Drive, Ram and Fan have only 2 or 3 materials
All textures are atlased in the same file and all normal map as well. …
On the GTX1080 I can run this scene at 66fps with a 2160p resolution
On the GT540M I have 8 to 10 fps in 720p
Some ideas coming…
Do u set effect parameters even when they havent not changed?
Do u cache them or call them with parameter[thestring]?
Have you tried sorting the meshes by material to lower the calls?
Maybe MRT could help by drawing the 6 materials in one for loop. And then combining the results.
Or 2 loops of 3 if the hardware does not support up to 8


 …
…