I’m running Windows 10 on an Alienware 15 R3, which has an Nvidia GeForce GTX 1070. I’m trying to check GPU usage for a simple engine I’m building on top of MonoGame; the build platform is DesktopGL. I’m not running into any performance issues, but I’d like to see what most of the time rendering is being spent on. However, I’m getting weird results in the Visual Studio debugger. Regardless if I’m rendering 5 or 100,000 objects, it never shows me any information I find a use out of whether it’s a Debug or Release build. Is this normal?
I’ve read that it might have something to do with Nvidia Optimus, but in the threads I’ve seen, they mention Visual Studio crashing or giving them an error; I get nothing of the sort, and as far as I know, my laptop model doesn’t support Optimus.
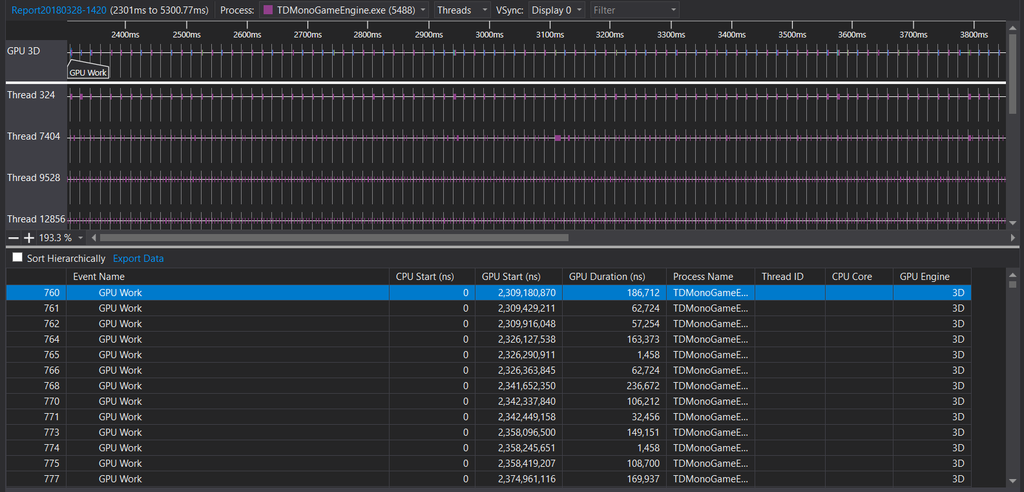
Here are pictures of what the windows look like for me:
GPU Profile Window
Detailed GPU Profile Window
I’d appreciate any insight or advice. Thanks in advance!
 ). I’ll upload new versions right now.
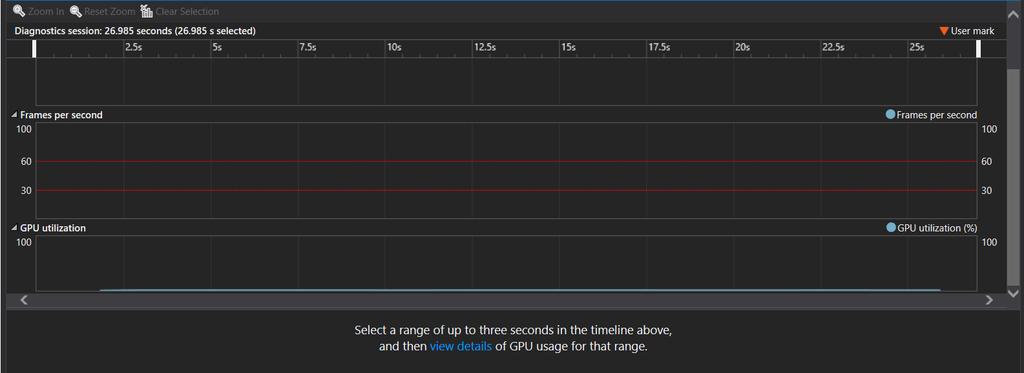