Hi all,
I am in the middle of writing a new renderer on top of Monogame.
So far I have world, asset management, and rendering all threaded up so I need to be able to check everything is working fine.
To do this I always add a profile build to the renderer and add code that monitors execution time and core usage.
The trouble is I cannot find out what cpu core any thread is running on.
I can find the thread affinity mask, but it’s just a mask. For example base.Update() has an affinity mask of 0xFF meaning it CAN run on any available core.
I just can’t find any way of finding out which core it is actually running on.
I even managed to break Google. I kept adding terms to the search string until it barfed 
Any body got any clues?
I’m not sure if it is feasible the Operating System handles and schedule threads task to whichever available cores best suited to run.
If I want to profile each thread, I will not worry on what core it is running from, I will just put a timer on each thread and get the result per second on all of the thread.
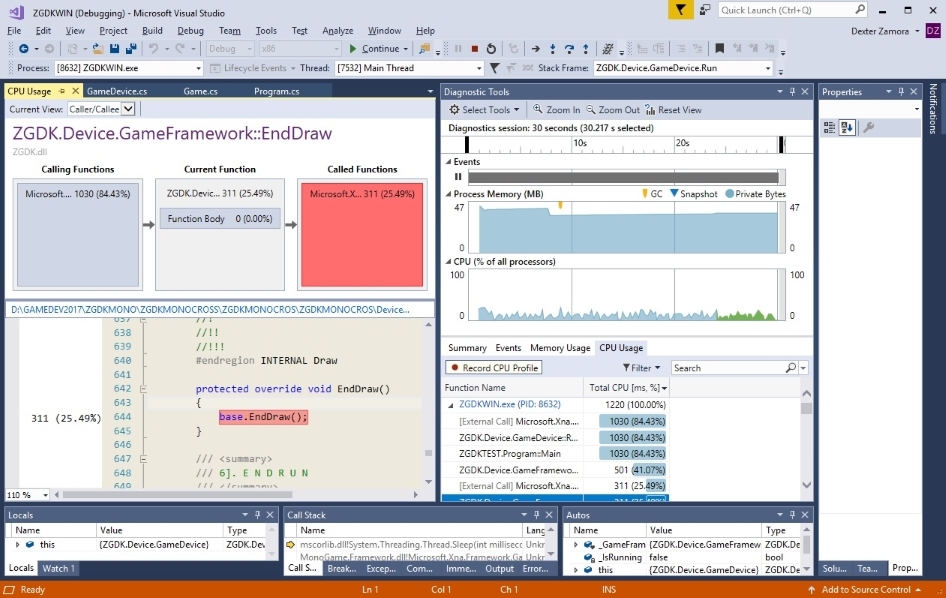
Out of the box VS2017 Community has a Diagnostic tools when you run an apps ^_^y
Yes, I know about that but it doesn’t give the sort of display you need when debugging complex multi-threaded games.
What you really need is the sort of tool I work with all the time. This is one I have used with great success.
Having something like this means you can detect those really hard to find bugs like a game component trying to change physics parameters on one core at the same time as the physics update is running on another.
Had a bit of luck… found this.
[DllImport("kernel32.dll", CharSet = CharSet.Auto, SetLastError = true)] public static extern int GetCurrentProcessorNumber();
Means I can only get the current core from the thread.
1 Like
Hey that works 
Also proves to me that Game.Update() and Game.Draw() are on separate cores 
1 Like
Does the per-thread filtering in the VS profiler not work for you? You’d still have to pair that up with filtering on something you expect to show up in the logs (which can be flakey).
1 Like
The data is there, it’s just displayed in a way that makes it very difficult to read.
With a proper display you can see things like stalls and cross thread locks very easily and I can record a bunch of frames so that you can find bugs quickly.