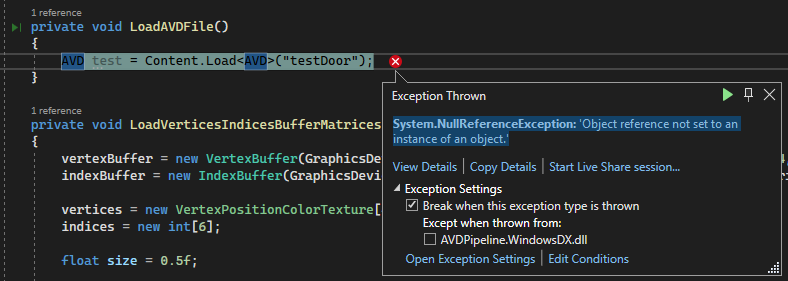
I tried to implement a custom content pipeline extension and it is not working on the loading side so when I try to load the content in the Game with
AVD test = Content.Load<AVD>("testfile");
I checked the Content folder and the XNB looks fine so everything else is working as far as I can tell. So I suspect the Exception is coming from the ContentTypeReader Read method but I don’t know what is happening there.
It should be possible to just use Debug.WriteLine(); and then look in your console output for messages.
When working with importers or processors you can also use context.Logger, which has the advantage that you can output messages even in the ContentBuilder window when compiling content for your project.
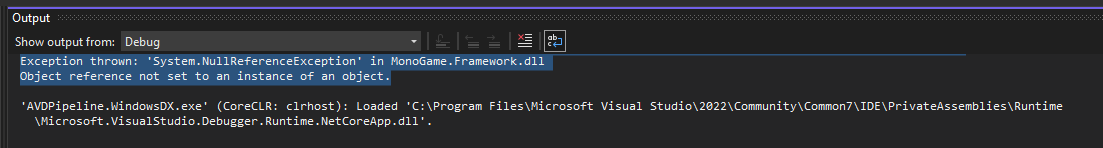
I don’t see anything although I have added context.Logger and Debug.WriteLine(); lines to the pipeline classes. In a normal Game debug session I just have the exception thrown at the Content.Load method…
I don’t have a good understanding of the debugging so I may be doing something stupid here maybe?
Do I need to somehow attach visual studio to the content pipeline process to debug it or something like that? How can I achieve this?
For the context logger messages you need to switch “Show output from:” Debug to Build.
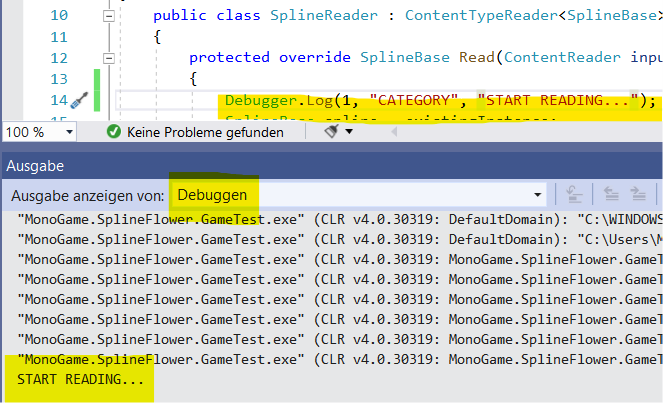
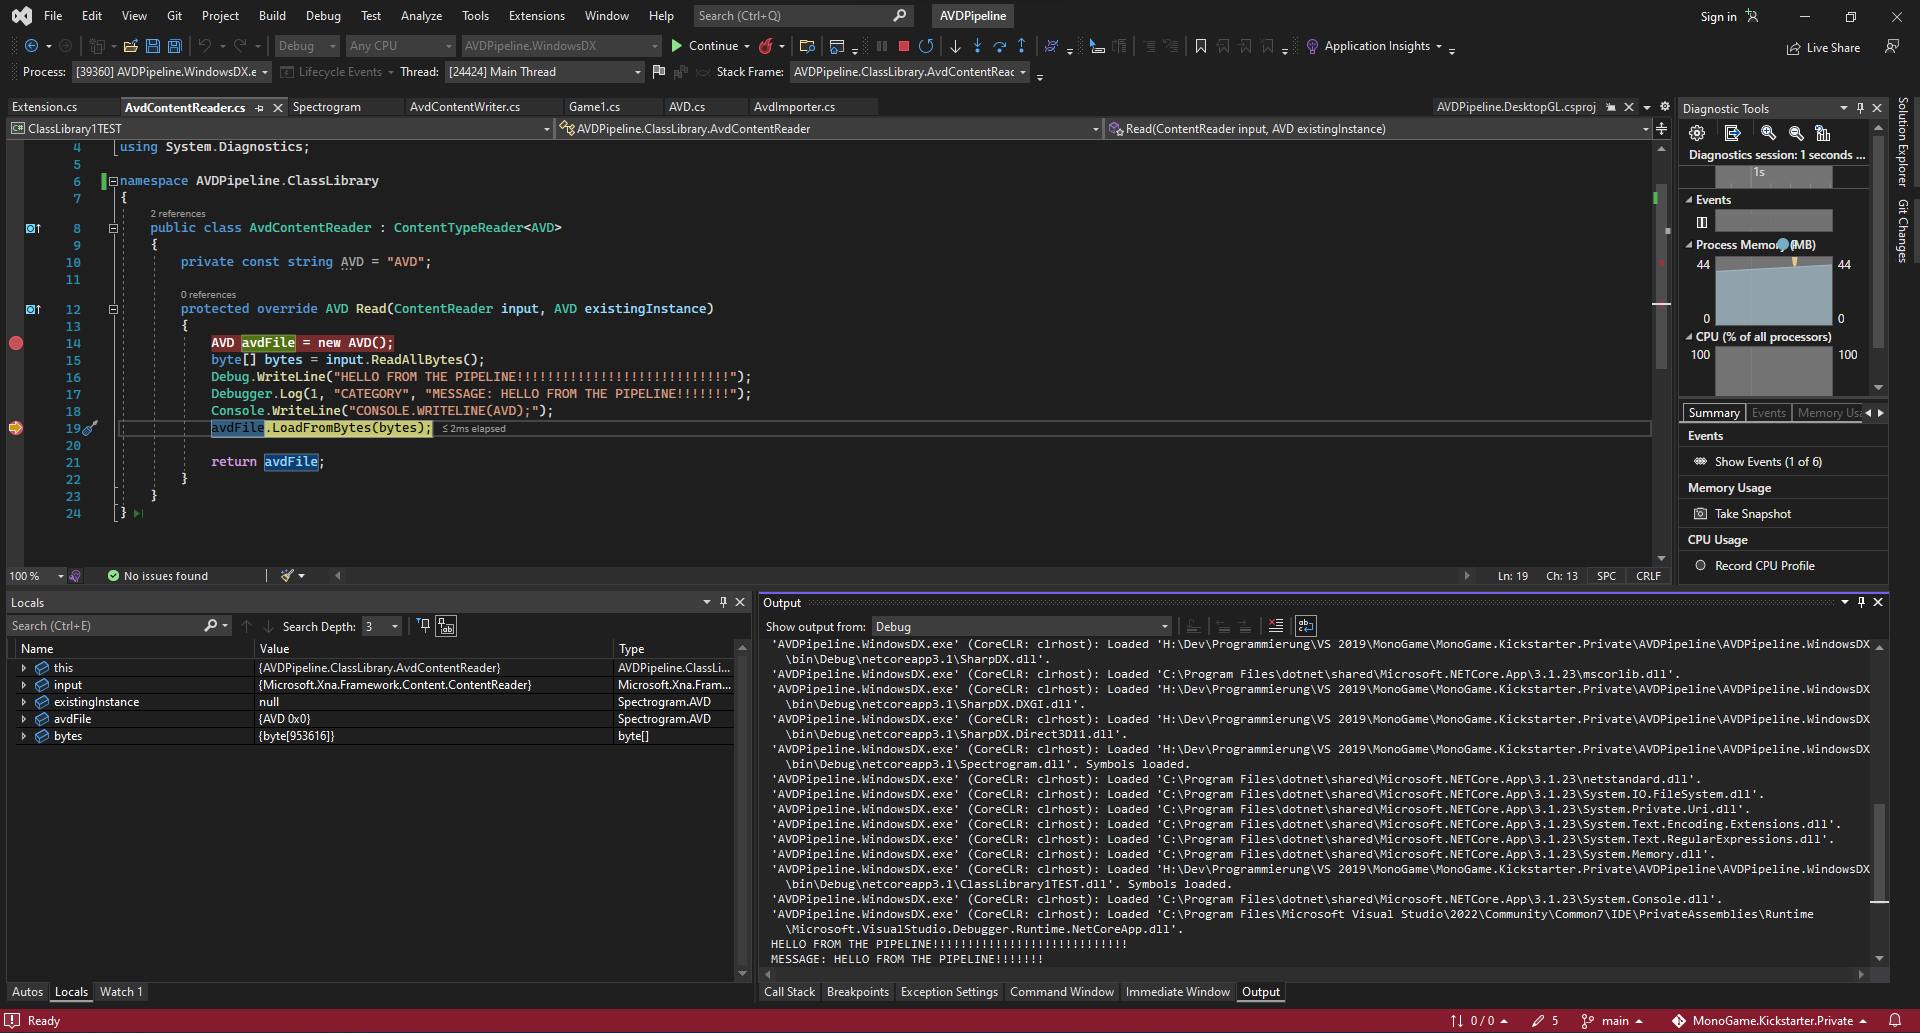
Ok, sorry it is not Debug.WriteLine() but it is Debugger.Log(1, "CATEGORY", "MESSAGE"); (appears in the Debug output).
Oh and instead of Debug.WriteLine() you could use Console.WriteLine(). Then you need to change your game project to a console application and you will see the messages there in the console.
Earlier in time you needed to launch a debugger beforehand with system.Diagnostics.Debugger.Launch()`, but it shouldn’t be needed anymore (idk for sure).
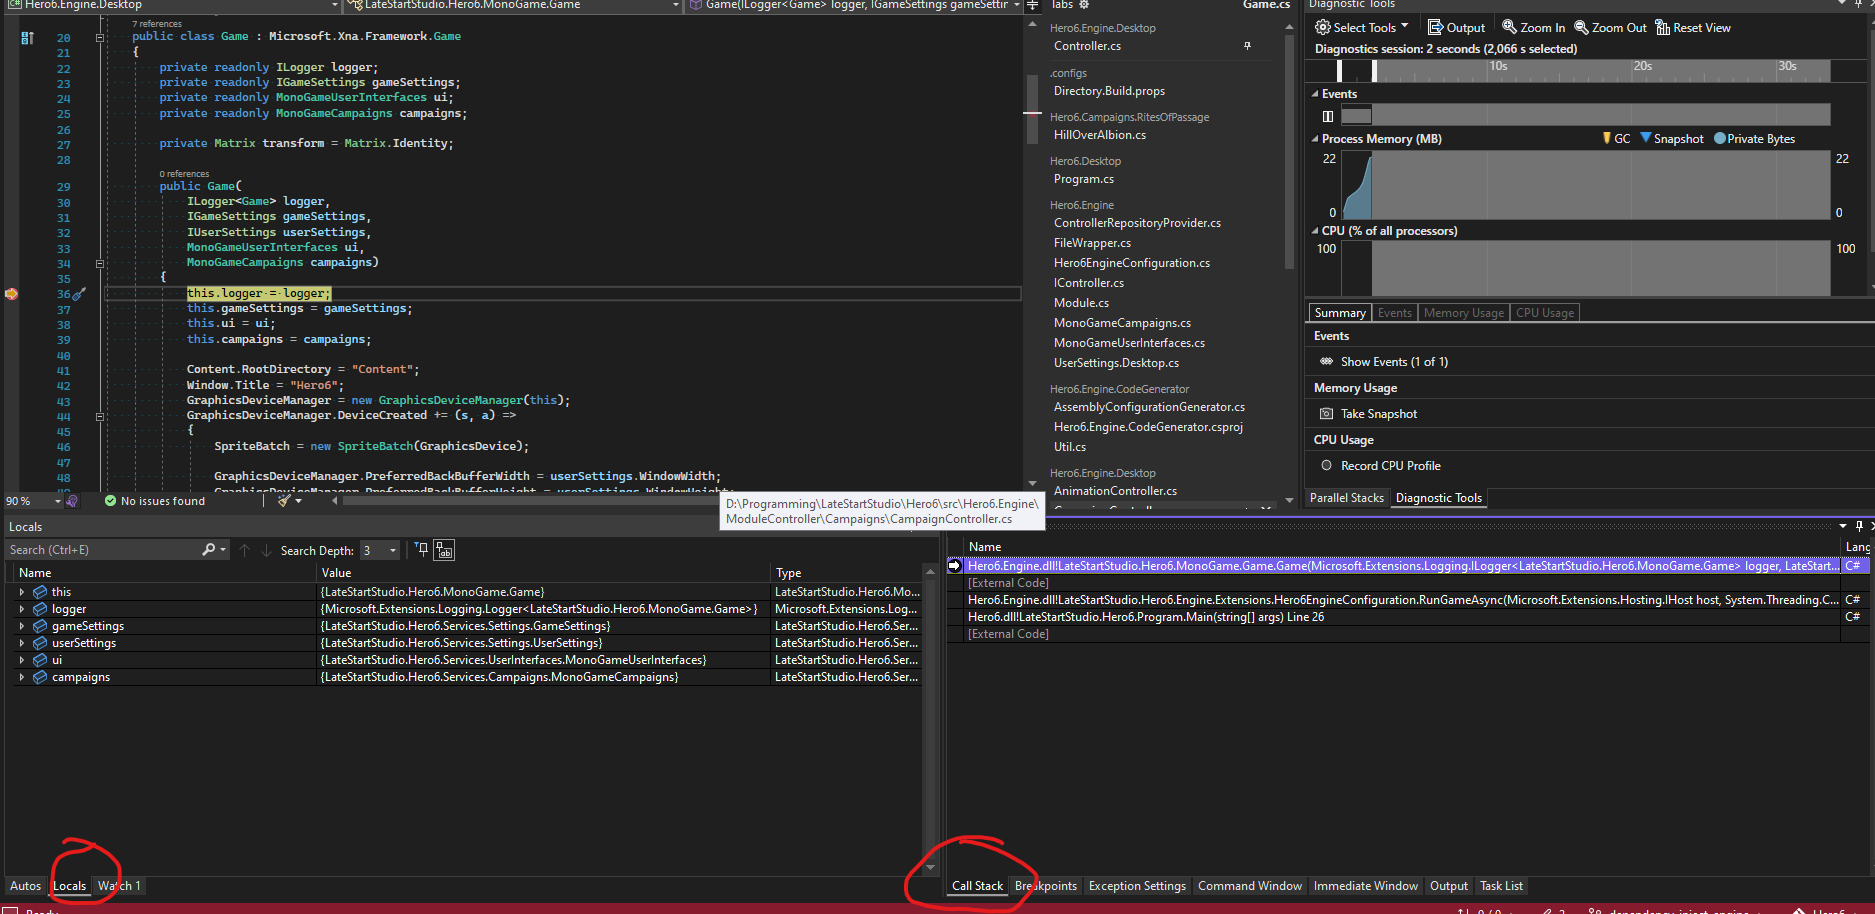
2 debugging tools I’d recommend for beginners, you can find both under Debug > Windows tool menu
First, the “locals” window. It shows you the values of the variables in the scope of your current breakpoint. If any of these are null they are probably good candidates to be your null exception. For example is your Content null? Because that would explain the exception we see. You can check using this tool.
Second is the call stack, using that you can see exactly how the code trave travelled to get where it is, it’s possible the null is somewhere there, either way it’s a great tool.
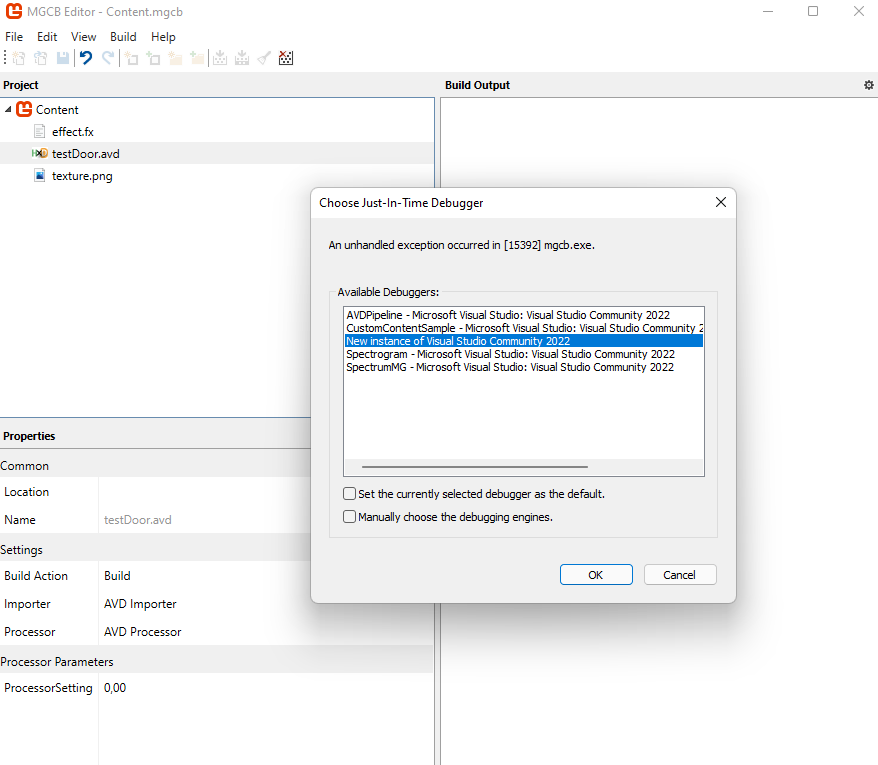
You can also debug the content pipeline extension code by activating debug from the mgcb editor. It should open up a visual studio dialog that takes you through the stuff you have to do
But the context variable is not available in the reader, right? So there I tried now both the Debug.WriteLine() and the ``Debugger.Log(1, “CATEGORY”, “MESSAGE”);` commands but I can’t find the messages then in the output (under Debug output?).
I can also try to change to a console application to get the console window where I can log some output but I guess I would prefer to step through the code with an attached debugger. That is what should be possible somehow (attach the visual studioq debugger to the pipeline classes / code but I don’t know how to do it. Would be nice if anybody who knows can explain the steps here to make visual studio stop on the breakpoints of the pipeline classes and not only in the Game where I then cannot see exactly what failed.
Yes the tools mentioned are great but I need to debug the pipeline extension not the game and breakpoints set there don’t work. The Content variable is not null here something else and I think it is happening in the pipeline code in the ContentTypeReader Read method.
So when I enable Build | Debug Mode in the MGCB Editor as suggested by @persn it opens a window asking me which debugger I want to attach. Is this what I want here?
There it asks me to navigate to a Program.cs… Which one? Is this the Program.cs of the MGCB Editor itself so I need to clone the MonoGame repository to have the source for it available? Maybe I don’t get it right but do I need this when I only really want to debug my pipeline extension code? I have a very bad understanding of what exactly is necessary here so I have too many questions and I am maybe doing very dumb things here ^^ Somebody please enlighten me ^^
Also I noticed I have added (the compiled) Dependencies (The Assemblies / DLL files of the project holding the AVD class). I will change this and better add the project *.csproj holding that file to the solution I guess? So then Visual Studio can figure out and can rebuild it if I for example modify the AVD code, right?
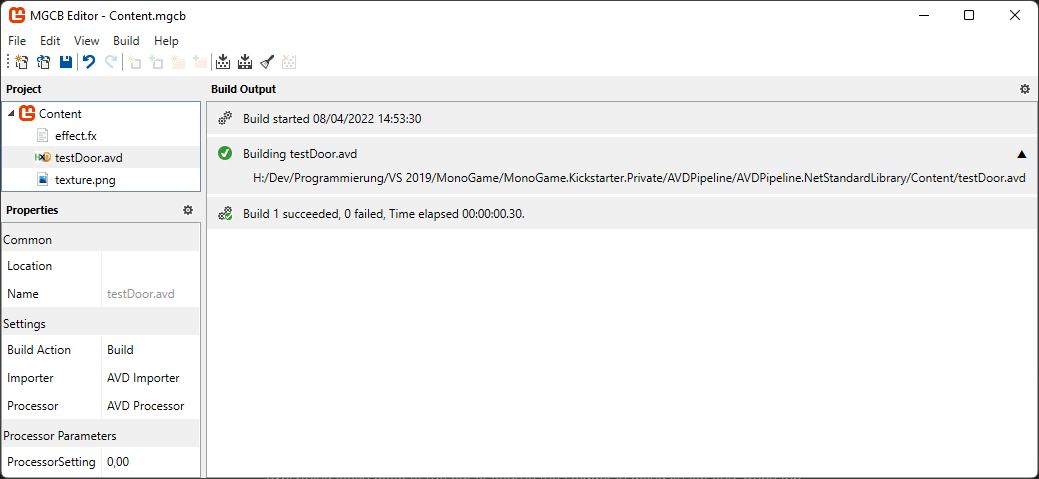
I added the projects for the AVD class to the solution and added project references instead of the Assemblies as references to the projects. In the MGCB Editor building the content works fine. And everything looks good to me but of course the Reader is doing its job only when the Content.Load<AVD>(); method is called from inside the Game, right?
But why does it not stop here? Again Do I need to set the MGCB Editor to Debug Mode and then chose the Program.cs from the MGCB Editor itself (so do I really need the MGCB Editor source here)?
You do not need the MGCB Editor source. I’m not sure which Program.cs it expects to find. I don’t have time to investigate everything you said properly but… I’m pretty sure your reader class is supposed to be in the same project where you run Content.Load<AVD> though. It can’t find the reader if you put it in the same project as the writer. That would also explain why no breakpoint triggers, no print lines are made. Your writer should have an overload for GetRuntimeReader method, the whole point about that is for you to input information about where your reader is located so monogame can find it
Feel free to check out my Content.Pipeline project and take what you need:
FYI: I can step into the readers code even without attaching a debugger. I only need to attach the debugger when I want to step into the code of the importer and the processor.
Edit: for me it totally works having the reader, writer, importer and processor all in one pipeline project.
So the last two answers helped me to figure it out… Will write it a bit later what the solution is but for now it is related to the Reader which the Content Pipeline could not find like @persn said.
Before I forget as a side note it works for me also when I have the Reader together with the other parts of the pipeline extension classes in one “pipeline” project (class library). If you have a reference when the Reader is inside another project it works fine. The point is the pipeline needs to know where it can find the Reader and that works through the mechanism of the Writers GetRuntimeReader method returning the full qualified name of the Reader class.
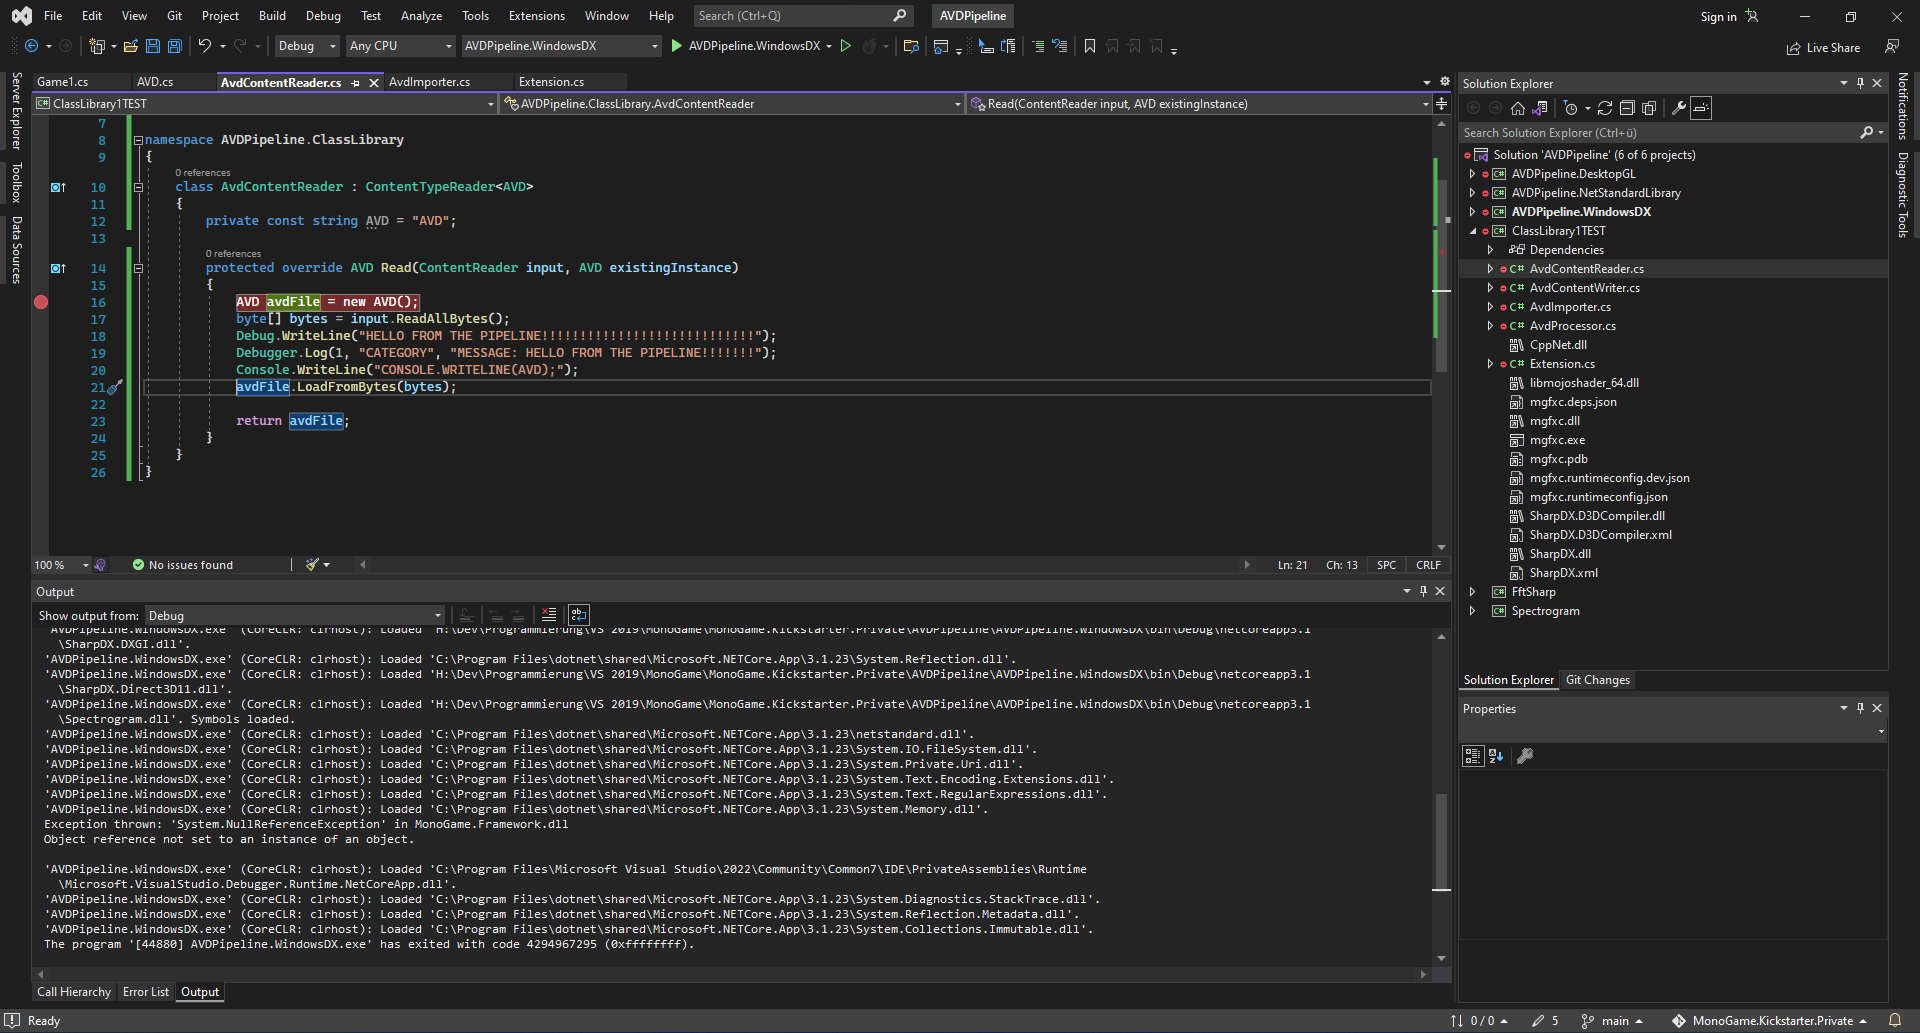
At first I suspected some untested code of an extension method I use / call in the Reader to be able to read all bytes coming from the ContentReader input parameter here:
protected override AVD Read(ContentReader input, AVD existingInstance)
{
...
byte[] bytes = input.ReadAllBytes(); // ReadAllBytes() is an extension method for ContentReader
...
}
    public static class Extension
    {
        public static byte[] ReadAllBytes(this ContentReader reader)
        {
            const int bufferSize = 4096;
            using (var ms = new MemoryStream())
            {
                byte[] buffer = new byte[bufferSize];
                int count;
                while ((count = reader.Read(buffer, 0, buffer.Length)) != 0)
                    ms.Write(buffer, 0, count);
                return ms.ToArray();
            }

        }
    }
so I suspected the exception was coming from there and at a first glance at least for me it looked like the exception was coming from inside the Reader.
Luckily @persn 's observation was spot-on right and the content pipeline could not find the reader because it had the wrong return value gotten from the GetRuntimeReader method which I had overridden but I had used the wrong class inside the typeof method… I did not think about it only when I read the answer that this method is what the content pipeline uses to find the right class at runtime to load the asset I noticed that my code was wrong.

 Thanks for the help