I’m finishing my last game, Mark In DeDark and now I’m worrying about performance.
Premise
- The game is a 2D top-down puzzle game
- I’m compiliing everything in
x86withMonoGame.Framework.WindowsDX - It is composed with 4 2048x2048 spritesheets
- The world is totally black and I render all the lights with a normal map shader (every sprite is pixel art)
- I also use Penumbra, but only for the player light (applying it on every other light was too expensive in terms of performance)
- I’m testing everything with 1422x800 resolution
- I didn’t put any sounds yet
- I set the framerate to 50 FPS:
_game.TargetElapsedTime = TimeSpan.FromSeconds(1d / 50d);and_game.IsFixedTimeStep = true;
Why I’m not happy with performances
Because the framerate isn’t constant. Sometimes it drops to 30 FPS, sometimes to 40 FPS, but rarely it is constant to 50 FPS. I already tried to set it to 30 FPS, but it isn’t constant either.
What I did to solve the problem
I already did a lot of profiling, and I already fixed some CPU bound problems. Now I’m asking your help because you have more experience with me with MonoGame and may have some advice I’m missing. (Thanks!)
What I saw
To do my tests, I created a “perfomance test level” in my game to use always the have always the same variables with the same PC (a HP Probook 450 with integrated graphic card Intel HD Graphics 4000, what to me is “the minimum”)
- CPU is never higher than 6%
- GPU is always in the range 70%/90%
- Framerate is in the range 25-50 FPS
Code profiling
I’m using Visual Studio 2019 Community
By profiling with “CPU usage”, i see:
-
In the whole session, the Update method takes 9,9% and the Draw method takes 17%. The other % are external methods (or parent methods that contains these two)
-
Inside the Draw method, Penumbra takes 5%.
-
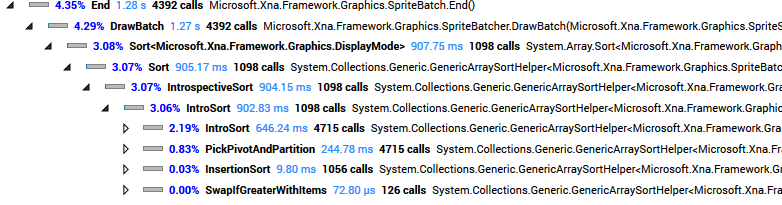
My biggest spriteBatch.End(); takes 4%, and digging into the method it seems that sprites sorting takes a lot of work (
spriteBatch.Begin(transformMatrix: viewMatrix, samplerState: SamplerState.PointClamp, sortMode: SpriteSortMode.FrontToBack);) -
The other % is drawing my multipass lighting for each light, that is done like this:
  public void DrawGroundWithNormalMap(
  	SpriteBatch spriteBatch,
  	Matrix viewMatrix,
  	Effect normalMapEffect,
  	Effect specularMapEffect,
  	GraphicsDevice graphicsDevice,
  	RenderTarget2D baseRenderTarget,
  	RenderTarget2D normalMapRenderTarget,
  	RenderTarget2D specularMapRenderTarget,
  	RenderTarget2D specularMapLightmaskRenderTarget,
  	RenderTarget2D specularMapWithAppliedLightmaskRenderTarget,
  	RenderTarget2D appliedNormalMapRenderTarget,
  	RenderTarget2D resultRenderTarget,
  	Action<SpriteBatch> drawGlows,
  	List<MarkLight> lights)
  {
  	// Tile set background cells
  	graphicsDevice.SetRenderTarget(baseRenderTarget);
  	graphicsDevice.Clear(Color.Black);
  	spriteBatch.Begin(transformMatrix: viewMatrix, samplerState: SamplerState.PointClamp);
  	OnAllVisibleCells(c =>
  	{
  		c.DrawGround(spriteBatch);
  	});
  	spriteBatch.End();

  	// Normal map
  	graphicsDevice.SetRenderTarget(normalMapRenderTarget);
  	graphicsDevice.Clear(Color.Black);
  	spriteBatch.Begin(transformMatrix: viewMatrix, samplerState: SamplerState.PointClamp);
  	OnAllVisibleCells(c =>
  	{
  		c.DrawGroundNormalMap(spriteBatch);
  	});
  	spriteBatch.End();

  	// Specular map
  	graphicsDevice.SetRenderTarget(specularMapRenderTarget);
  	graphicsDevice.Clear(Color.Black);
  	spriteBatch.Begin(transformMatrix: viewMatrix, samplerState: SamplerState.PointClamp);
  	OnAllVisibleCells(c =>
  	{
  		c.DrawGroundSpecularMap(spriteBatch);
  	});
  	spriteBatch.End();

  	// Specular map lightmask
  	graphicsDevice.SetRenderTarget(specularMapLightmaskRenderTarget);
  	graphicsDevice.Clear(Color.Black);
  	spriteBatch.Begin(transformMatrix: viewMatrix, samplerState: SamplerState.PointClamp, blendState: BlendState.NonPremultiplied);
  	drawGlows(spriteBatch);
  	spriteBatch.End();

  	// Apply normal map
  	graphicsDevice.SetRenderTarget(appliedNormalMapRenderTarget);
  	graphicsDevice.Clear(Color.Black);
  	normalMapEffect.Parameters["NormalTexture"].SetValue(normalMapRenderTarget);
  	spriteBatch.Begin(SpriteSortMode.Immediate, BlendState.Additive, SamplerState.PointClamp, null, null, normalMapEffect);
  	foreach (var light in lights)
  	{
  		// Because the light is off-screen
  		if (!light.ShouldDraw)
  			continue;

  		normalMapEffect.Parameters["LightPosition"].SetValue(light.PositionForGround);
  		normalMapEffect.Parameters["LightColor"].SetValue(light.ColorNormal);
  		normalMapEffect.Parameters["LightDistanceSquared"].SetValue(light.DistanceSquared);
  		normalMapEffect.Parameters["LightOpacity"].SetValue(light.Opacity);
  		spriteBatch.Draw(baseRenderTarget, Vector2.Zero, Color.White);
  	}
  	spriteBatch.End();

  	// Lightmask for the specular map
  	graphicsDevice.SetRenderTarget(specularMapWithAppliedLightmaskRenderTarget);
  	graphicsDevice.Clear(Color.Black);
  	specularMapEffect.Parameters["SpecularTexture"].SetValue(specularMapLightmaskRenderTarget);
  	specularMapEffect.CurrentTechnique.Passes[0].Apply();
  	spriteBatch.Begin(effect: specularMapEffect);
  	spriteBatch.Draw(specularMapRenderTarget, Vector2.Zero, Color.White);
  	spriteBatch.End();

  	// Final composition
  	graphicsDevice.SetRenderTarget(resultRenderTarget);
  	graphicsDevice.Clear(Color.Black);
  	spriteBatch.Begin(blendState: BlendState.Additive);
  	spriteBatch.Draw(appliedNormalMapRenderTarget, Vector2.Zero, Color.White);
  	spriteBatch.Draw(specularMapWithAppliedLightmaskRenderTarget, Vector2.Zero, Color.White);
  	spriteBatch.End();
  }
This is the point in which I think I have to work more. Because it is a little ugly.
- I draw the ground that you see by the camera
- I draw its normal map
- I draw a sort of specular texture for each game ligth, and I apply a lightmask to it (to show only certain parts of it)
- I apply the normal map - foreach game light - with a shader
- I apply the specular lightmasked
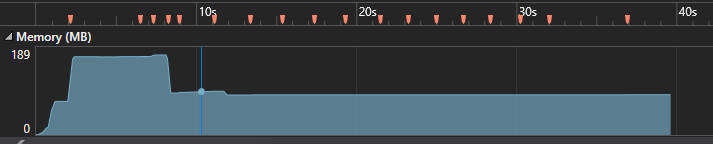
Garbage Collector
Each red point is an automatic garbage collection
My questions
- In your opinion, should I try to have smaller spritesheets? Is it very important? I could reduce all my textures by 1/4, by then I would have to apply a scaling in each
Drawcall. - In your opinion, can I do something better in my big
Drawcall? Did I do something very horrible with the shaders calls? - Do you think the Garbage Collector comes too frequently?
- Do have any other advices?
Thanks a lot!