Using Visual Studio’s built in memory profiler, it’s clear that some sort of memory leak is happening in my game. The problem is, I took steps that I thought for sure would drastically reduce the problem, and they did not.
Each time the resolution of my game is changed, an event is published that allows various aspects of the game to react appropriately to the change. The problem was (at least I thought it was the problem), I was creating a bunch of new objects each time the resolution was changed, and those objects weren’t being allowed to be garbage collected because stale references were being kept alive by the events that they had subscribed to. To mitigate this as much as I could, I replaced new object creation with object reuse instead.
The result? Using Visual Studio’s memory profiler, I could see that my object creation had reduced significantly. Only problem was, the memory increases hadn’t. The leak was still there.
What makes this weirder is that, using Resource Monitor and monitoring the app while it automatically changes resolution repeatedly, I can see the committed memory going up each time, but the working set hardly increases by comparison. As a result of this, my game’s memory usage as listed in Task Manager never really goes up, and the amount of physical memory freely available in my system doesn’t decrease, even when, according to the Visual Studio memory profiler, my app is up to 5 GB of memory (up from 100 MB!) after ten-plus minutes of non-stop resolution changing.
Worse still, according to MSI Afterburner system monitoring, the VRAM in use by my game goes up with each resolution change as well, even more than the system memory. Edit: Is it possible that what’s going up is actually a shared video memory that both Afterburner and Visual Studio keep track of?
Here’s a screenshot of the results of one memory profiling session in Visual Studio.
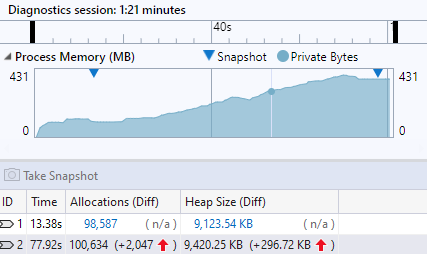
As you can see, the amount of memory increase between the two snapshots as shown in the graph is much higher than the difference listed in the table below.
I honestly have no idea what’s going on, and I’m not sure what to do. Obviously no real-world user of my game would sit there changing the resolution repeatedly, so the likelihood of this particular leak causing significant problems during actual use is very low, but I don’t like that my game isn’t robust enough to not have this issue in the first place.