Optimising a 3d-tilemap, in addition to culling.

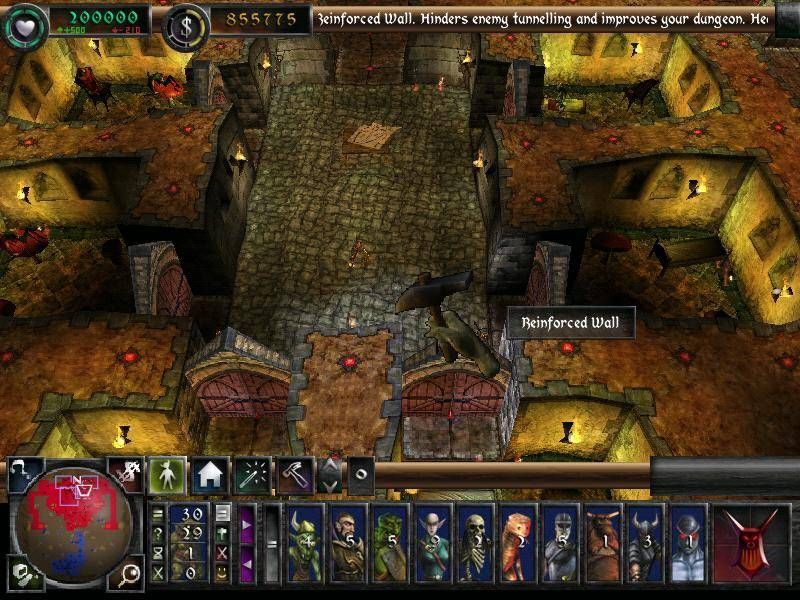
Imagine a 3d game like dungeon keeper 2, where levels are made of 3d tiles, mostly “floor” or “walls”, in a constant size.

I’m looking for ways to optimize this thing because even with smart culling performance are not good enough on laptops. I tried both octree culling and bounding boxes based culling (+bb while dividing the map into batches) and while it improves performance noticably it’s still not enough

I’m also caching world matrix of tiles (calculate them once per tile) so that’s not an issue.

I realize I can’t be as fast as Dungeon Keeper 2 because:

  1. My textures are larger.
  2. My resolution is larger.
  3. In DK2 they probably build a static mesh from vertex buffers (their tiles have pretty basic shapes with an element of randomness in them) but in my case I have to use models (tiles have complicated shapes).

Do you know any ways or have ideas how to optimize this? Also, I prefer not to use geometry shader at this time.

Edit: also forgot to mention using LOD optimizations won’t help because for the sake of testing I used a very basic model for tiles and it’s still not fast enough on laptops.

Pic related: screen from DK2

Thanks,
what is not fast enough - the rendering or the culling?

For a 3d strategy game with a 2d world (not changing in height, like DK2 for example) you can create a bounding box on the ground which approximates your frustum. Checking against the BB might be magnitudes faster than checking against the frustum, at the cost of less efficient culling.

I mean, if you make a map small enough that it just fits the camera frustum, so you do not need culling at all - is it still too slow? In that case there is no hope for you to hit the performance target.

Thanks, this question made me check something and realize that the problem wasn’t in drawing, it was in the Update loop calling recursively to all objects update (something internal) even for the hidden tiles.

Anyway FPS problem is solved, I was looking in the wrong places.

With the performance analyser of VisualStudio or Ant profiler, you would have found this in the first place.
I always launch a profiling sesion before scratching my head, wondering where the problem can be.

1 Like

That’s how I eventually found it :slight_smile: